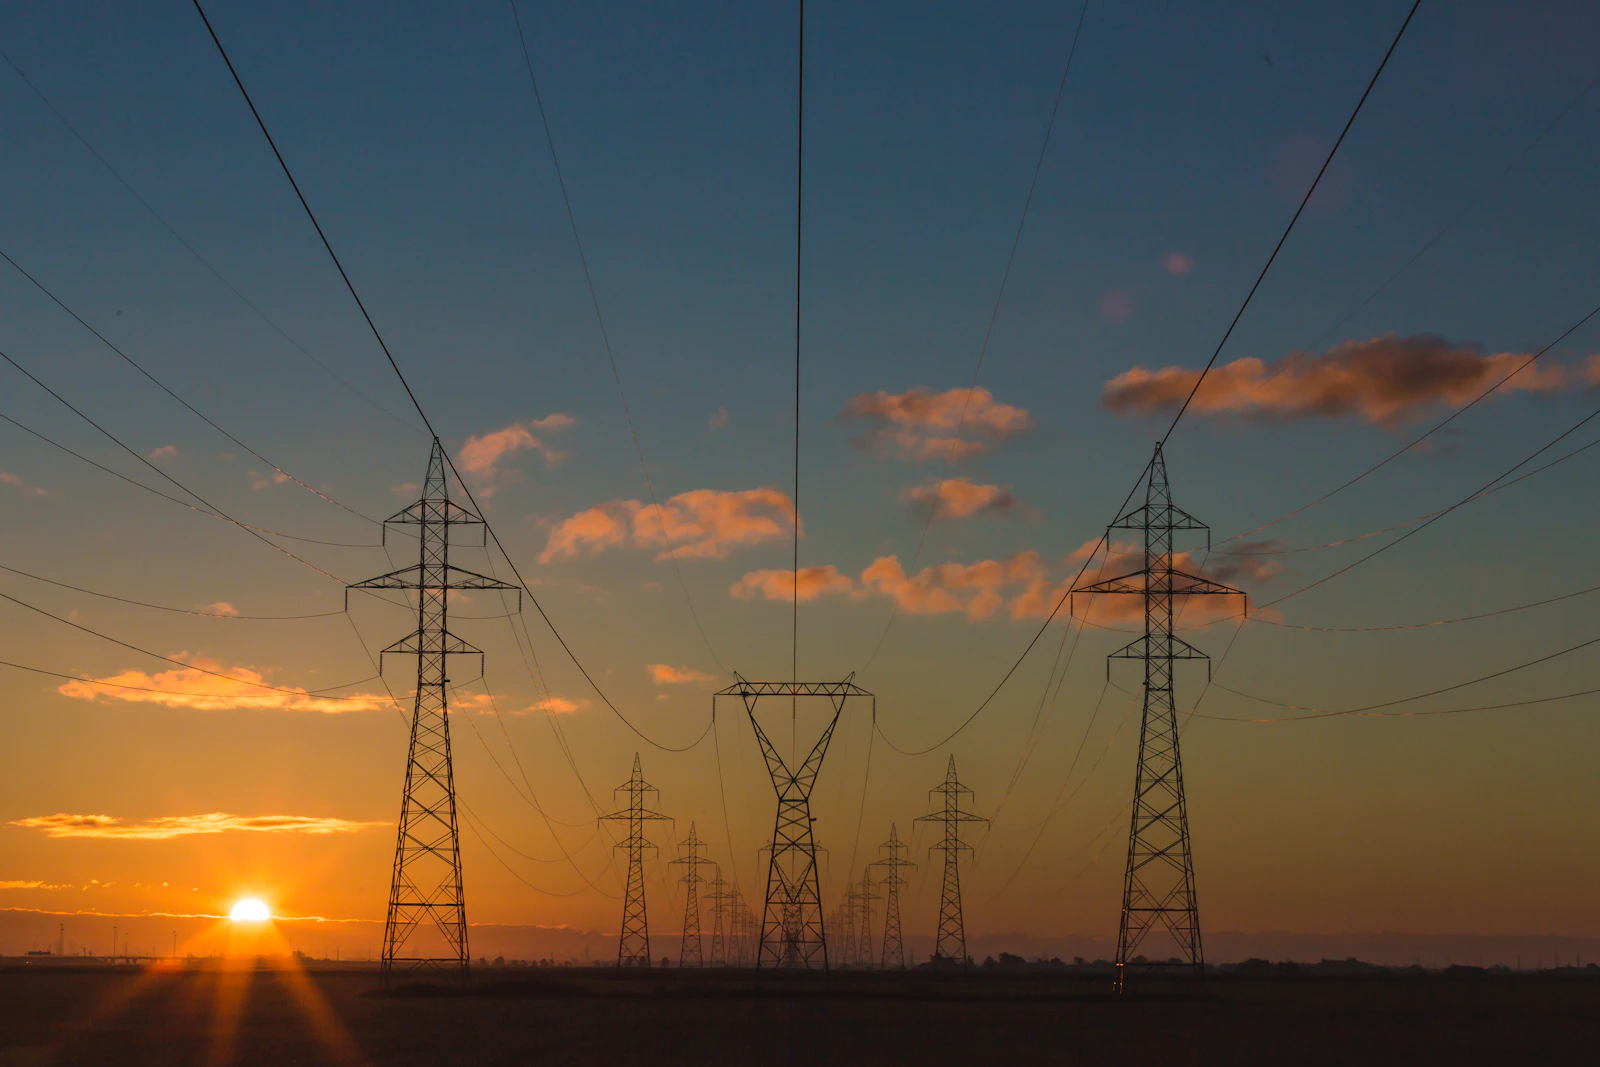
High-voltage transmission towers at dusk above a dark corridor of land

The hour after the trip still has to be reconstructed.

From a Batumi desk we read event logs, shift notes, and site photographs until a feeder trip, a pump stall, or a possession overrun can be told in order.

Alarms arrive in a flood. Restoration is a scramble. Days later a director, a regulator, or a neighbouring operator asks what actually happened between 03:14 and dawn. Kernelstreamhub Analytics is the practice that sits with those records and draws the hour so other people can follow it.

We are not a dispatch room and we do not sell a login. We take a named event, gather the paper and the files that survive it, and return a briefing: chronology, contributing factors, and the pictures that make the sequence readable.

Commissioned analysis

Send the event file

What arrives on the desk

Logs, photographs, and the gap between them

A typical packet that lands on Level 8 includes SCADA extracts, a night-shift logbook with two missing hours, photographs of a burnt contact, and a verbal account that does not match the timestamps. We treat that mess as the work, not as a failure of the client.

The practice grew out of reconstruction work for operators along the Adjara coast and inland toward the hydro cascade. Port cranes, municipal water, Georgian Railway possessions, and 110 kV feeders all leave different kinds of traces. The common need is the same: someone who was not on the night shift must still be able to see the order of events.

We print. Charts are drawn so they survive a photocopier. Maps keep the feeder names the operators actually use. If a clock in the substation and a clock in the control room disagree, that disagreement is stated, not averaged away.

Flagship commission

Infrastructure event analysis

A commissioned reconstruction of one named incident, returned as a bound briefing with a drawn chronology.

The flagship commission is for the event that already happened: a feeder trip, a pump-station flood, a traction-power sag, a crane stoppage at the port. You send what you hold. We visit if the site still shows the marks. Two to four weeks later the briefing is on the table — what is known, what cannot be known, and the pictures that carry the hour.

Read the full scope

Related commissions

Work that sits beside the incident file

Cooling towers and industrial steam against a muted sky

Infrastructure event analysis

Commissioned briefing · Two to four weeks after the file is complete

A bound reconstruction of one named incident — feeder trip, pump failure, possession overrun, crane stoppage — with a drawn chronology and a clear list of what the records cannot prove.

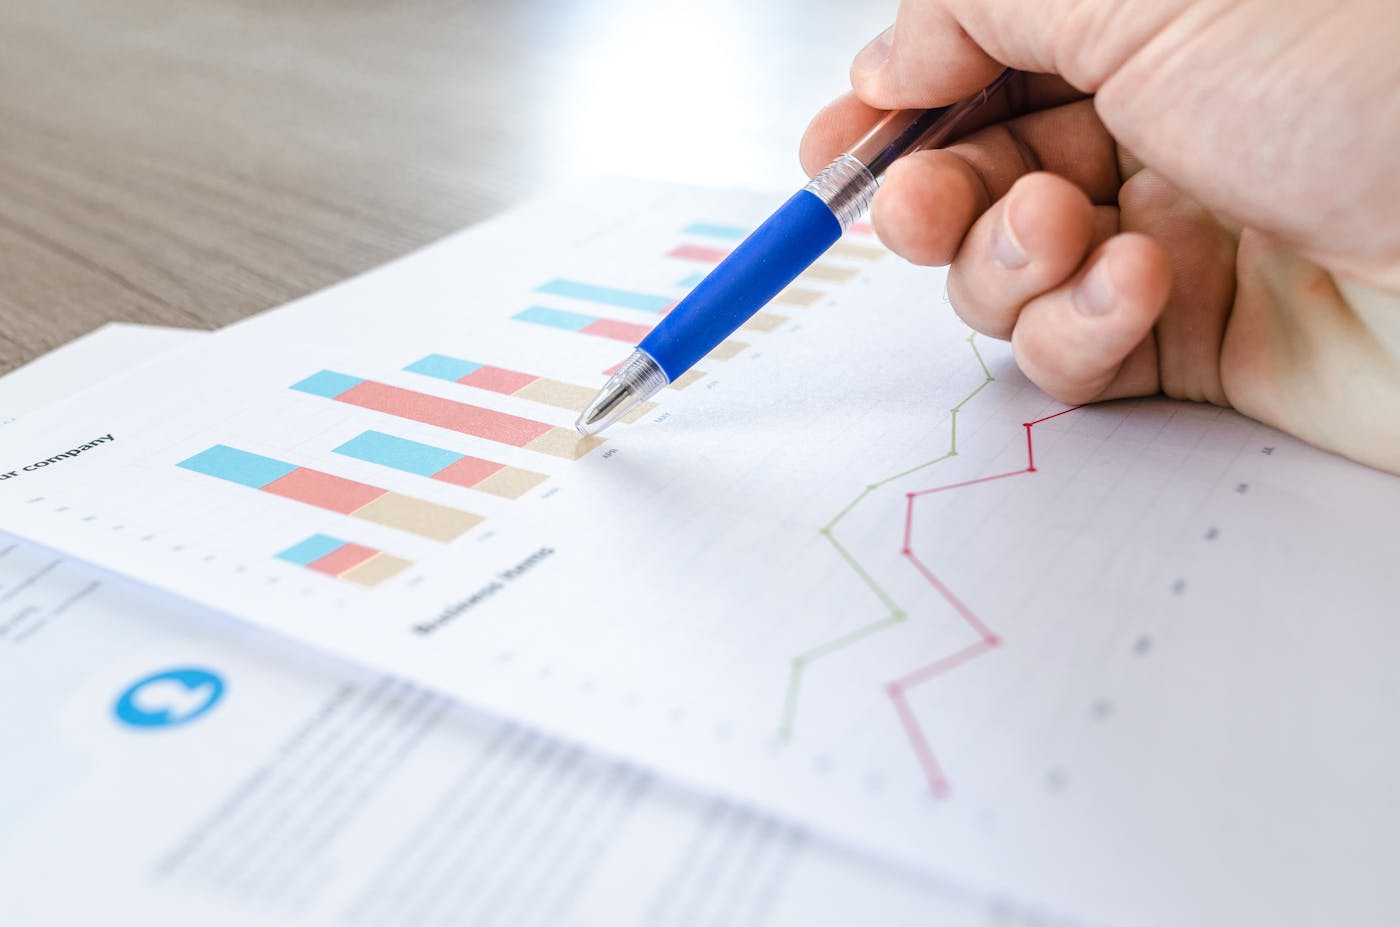
Printed charts and figures spread across a wooden table

Event visualization

Commissioned plates · Five to twelve working days

Print-ready plates of a sequence you already know: restoration charts, feeder maps, and time-labelled drawings that survive a photocopier and a board table.

Engineer in a plant aisle reviewing equipment during a walk-through

Operational review

Seasonal retainer · Two weeks at the end of each quarter

Once a quarter we read the events you accumulated, mark the repeat trips and the silent hours, and return a short note before the next season of load or rain.

From a recent file

Chorokhi feeder, a Thursday before dawn

The restoration log said 04:40. The protection flags said 03:51. Nobody had written down who changed the clock after the last maintenance.

A municipal operator on the Adjara coast asked us to settle that gap before a neighbouring utility repeated the story incorrectly. The briefing did not invent a single timeline. It showed both clocks, the photographs of the panel, and the ten minutes in which load was picked up on the wrong bus. That is the kind of file we keep in the drawer.

Open the case-file drawer · Letters from operators

Field notes

Pages from the working journal

All field notes